
 All Blog Posts
by Lainie Schuster and Nancy Canavan Anderson
Asking “good” questions—questions that help students make sense of math—lies at the heart of good math teaching. In Good Questions for Math Teaching: Why Ask Them and What to Ask, Grades 5–8 (Math Solutions Publications, 2005), Lainie Schuster and Nancy Anderson provide teachers with questions across seven math strands. The questions are open-ended and offer opportunities for a range of students to engage in mathematical reasoning. The book’s questions for the data analysis strand give students experiences that help them learn to:
- write questions, design studies, and gather data about a characteristic of a population;
- use data taken about a sample to make conclusions about the population from which the sample was taken;
- choose, create, and apply appropriate graphical representations of data sets, including histograms, stem-and-leaf plots, box-and-whisker plots, and scatter plots; and
- interpret and compare data using measures of central tendency.
The following excerpt presents five questions that focus on data analysis and includes brief commentary for the teacher.
- Imagine you wanted to find out the favorite movie of students in your school. How would you accomplish this? What are the advantages and disadvantages to your plan?This question presents a good opportunity to discuss different types of sampling, such as random sampling, convenience sampling, and voluntary response sampling.
- A local newspaper reporter wrote an article claiming that more than 75 percent of the town’s citizens thought the library fines were too high. Many readers wrote to the editor refuting the report, claiming that the sample for the survey was biased. How might the sample have been biased?This question can help students develop the ability to look beyond the headlines and evaluate their validity, which is an important skill in today’s data-driven world.
- You read in an ad: “Four hundred more people prefer the new and improved Bright Smile toothpaste to another brand.” How might this data be misleading?Students should consider the size of the sample as well as the way the survey was conducted (e.g., with what other toothpaste was the new and improved Bright Smile compared?) when answering this question.
- Recently, two members of the student government surveyed the seventh-grade class and obtained the following results. What might their survey question have been?
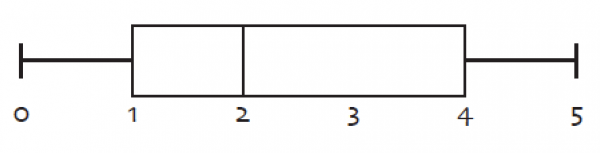 Once students determine a sensible survey question, ask them to interpret the results using what they know about box-and-whisker plots. For example, a student might think that the survey question was “How many pets do you own?” That student should then be able to say, “Approximately half of those surveyed own two or more pets.”
 - Last year, I surveyed my students, asking them how long they studied for an exam.
- Then I made a scatter plot showing the relationship between hours spent studying for an exam and the exam results. What do you think this scatter plot looked like?Encouraging students to visualize a graph that shows certain conclusions can help them make sense of the features and purposes of such a graph. A good follow-up question to this one could be “Why was a scatter plot a good choice for this data?”

Click here to download the PDF
Comments