
First, Second
 All Classroom Lessons
A Lesson for Eighth Graders
by Jennifer M. Bay-Williams and Sherri L. Martinie
In Daniil Kharms’s First, Second, four travelers meet up on a journey. One man is very tall, another very short, and the other two are average height. In this lesson, students are given information about how many paces it takes three men of different heights to go a given distance. Students represent the information in three ways—on T-charts, as graphs, and with equations. This story offers a wonderful opportunity to contribute to students’ understanding of algebra and also further their understanding of proportional reasoning. Jennifer M. Bay-Williams and Sherri L. Martinie are the authors of the forthcoming book Math and Literature, Grades 6–8.

After reading Daniil Kharms’s First, Second to a class of eighth graders, I wrote the following on the board:
A tall man, an average man, and a short man each walked with different length paces. The tall man walked five meters in five paces. The average man walked two meters in five paces. The short man walked two meters in ten paces.
I asked, “How do the distances and paces of each man compare with one another?” After a long silence I said, “It happens sometimes that we don’t know where to start. What could we do to make the travelers easier to compare?”
Sam suggested, “You could change all of the travelers to five paces . . . or ten paces.”
“Why?” I asked.
“I’m thinking about counting by two and it would be easier to change two to ten rather than five. If you count by two you don’t hit five,” he explained.
“Why are you counting by twos?” I probed.
“I’m trying to figure out what to multiply by to get two paces and five paces to be ten paces. If I try to change everything to five paces, I’d have to multiply two meters by a ‘point something’ and I’d have to divide the ten paces in half to get five. That’s too much work,” he explained.
“What else could we do?” I asked.
“We could multiply, like Sam said, but concentrate on the meters instead of the paces. I’d change the meters to ten just like Sam said to do with the paces,” Lisa answered.
“What else?” I asked.
“It would be harder, but we could try to get the paces or the meters all to one rather than ten,” Lyndsay suggested.
“Why would it be harder?” I asked.
“First you’d have to use division and that isn’t always easy. It also looks like some of those numbers are going to be fractions or decimals after we divide. That makes it harder, too,” she explained.
“All of your ideas are good ones,” I said, “but I’d like us to explore Lyndsay’s idea a bit more. Let’s think about how many paces it would take each of the men to walk one meter. That would give us a unit rate of paces per meter for each of them. Take a few minutes to work on this question in your groups.”
After about five minutes I got the students’ attention and asked them to explain what they found out about the ratios. Angie said, “The tall man was the easiest because the meters and paces were the same number, five, and so you know that he takes one pace to go one meter.”
“So it’s a one-to-one ratio,” I said.
Zach continued, “The short man was probably the next easiest because you can just divide by two to get one meter and ten will divide easily by two also, so he takes five paces for one meter.”
“That’s a one-to-five or five-to-one ratio then,” I confirmed. “What about the average man?”
“Well, you could take off a meter and a pace and then you would get four paces per meter,” Sandi offered.
I held up two-meter sticks and asked, “If I take away one meter as you suggest and have four paces in this one meter (holding up one-meter stick), what happens when I put this other meter stick back on?”
“You would get eight paces, not five, because each meter stick should be the same,” Don answered. “If you get one meter equals four paces, then the other meter has to be four paces, too. If it’s three paces for each meter, that’s six paces for two meters. Two paces in each meter would be four paces in two meters, and that isn’t enough,” he explained.
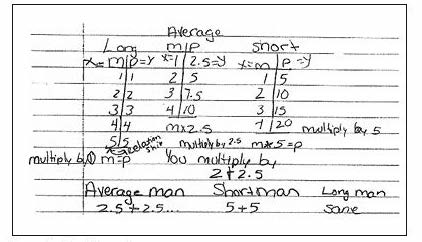
“It has to be two point five paces in a meter,” interrupted Sandi, “because if you add two point five and two-point-five, you get five paces.” (See Figure 1.)
 “Is there another way to get two point five paces per meter?” I asked.
“You could just divide. Five divided by two is two point five,” answered Luke.
“Why do we divide by two?” I asked.
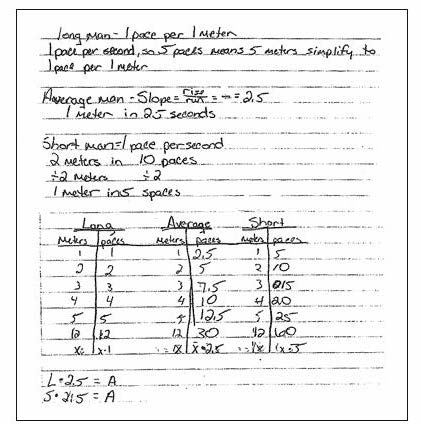
“Because there are two meters. You were holding up two meter sticks for the average guy,” explained Luke. (See Figure 2.)
“So what is the ratio for the average man?” I asked.
“He goes one meter in two point five paces,” Sandi said.
“Now that we know this, let’s think about representing what we know,” I said. “Can you figure out how many paces each of the men would take for two meters?” The students nodded. “Three meters?” They nodded again.
“You could figure it out for any number of meters,” Joe said.
“OK,” I said, “work in your groups to create a T-chart and a graph for the data about each of the men. What would you label the two columns of your T-chart? Talk about that with your group.”
After a moment, I asked the students for their attention. Several reported and the students agreed that they would label the first column of their T-charts Meters and the second column Paces. I suggested that they write in the Meters column 1, 2, 3, 4, and 5 and then jump to 12. I thought they would see the pattern after 5 meters and hoped they’d be able to generalize for any other number of meters. We then talked about how they would graph the information, and they agreed that they would show paces on the y-axis and meters on the x-axis. I gave them time to work.
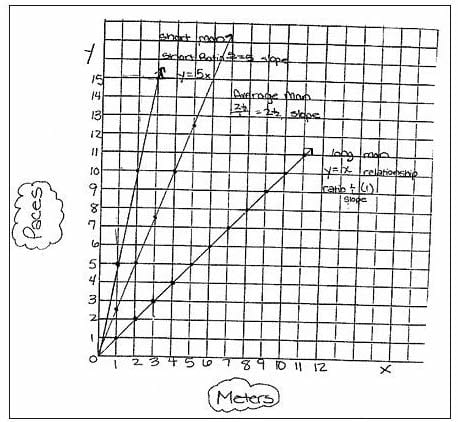
When most students were finished, I called for their attention. “Now that you have your graphs, how do they look compared with each other?” I asked.
Though the students had not been formally introduced to the concept of slope, they were able to construct some of their own ideas by exploring the points they plotted on the graphs of these lines. They studied the slopes of the lines to illustrate the differences in the men’s walking. For example, students discovered that on the graph for the short man, they could count up five and over one from any point to get to another point on the line. On the other hand, the line for the tall man was not as steep—every time you went up one, you went over one to stay on the line. They realized that this meant the tall man didn’t have to take as many paces to go a meter.
I asked them what they thought the steepness of the points on any of the graphs told them.David said, “It would be easier for a tall man to walk long distances because he wouldn’t have to take as many steps . . . just like in the book.”
Rebecca had a different interpretation. She explained, “If you look at the graph, the graph for the tall man wouldn’t be as hard to climb as the short man’s because it isn’t as steep.” I talked with the students about giving a number value to the steepness and how their ideas of “up and over” could be useful. I told them that we use the word slope to describe the steepness of a line on a graph.
I also asked the students to write an equation for each man that would represent the relationship between the meters and paces. Some used their T-charts and others used the graphs to determine the change in the meters compared with the change in paces. I asked students to explain in words what the equations were trying to say. Many students were able to explain that y = 2.5x tells us that for every meter there are 2.5 paces. I asked them to label their graphs with the equations.
As we discussed the similarities and differences among their tables, graphs, and equations, students were beginning to discover connections among these representations. When I asked them to write an explanation for slope, Allison wrote: A slope is a way to organize your data. We organize our data like how many paces per meter on our graph. From that we can see whose paces were faster than the rest. When we organize our data it’s easier to visualize that data. Joe wrote: Slope tells you the relationship between two things. In our table and graph it tells us how the meters and paces are related. After listening to others’ definitions, many students went back and revised their own. We talked about how these were “working” definitions and would change as they gained more experience with slope.
Related Publication:
Math and Literature, Grades 6–8
by Jennifer M. Bay-Williams and Sherri L. Martinie
Comments